
- Demography: The scientific study of the human population (their size & density, composition and distribution across space – and the process through which populations change. and statistics).
- 3 Major factors influencers of demography (population stability or change) are:-
- Birth
- Deaths &
- Migration
- Application of Demography:- study of human population provides age specific data for planning, scientific, technical and commercial purposes.
- In demography 3 parameters are observed:-
- Change in population
- Composition of population
- Distribution of population
Demographic cycle:
The demographic cycle, or population cycle or Demographic Transition Model”, refers to the evolution over time of the population profile of a country, region or other defined geographical area.
There is 5 stages in demographic cycle:-
| Stage | Characters |
|---|---|
| 1st/High Stationary | High Birth rate & High Death rate (BR & DR ) |
| 2nd /Early Expanding | BR unchanged but DR so population expand |
| 3rd /Late Expanding | BR just start to decline & but DR further increase more so population |
| 4th/Low stationary | Low BR & Low DR so population become stationary |
| 5th/Declining | DR> BR so population decline |
1. First stage (High stationary):
This stage is characterized by a high birth rate and high death rate which cancel each other and the population remains stationary. Till 1920, India was in this stage.
2. Second stage (Early expanding):
The death rate begins to decline while the birth rate remains unchanged. As the birth rates remain high, the population starts to grow rapidly.
3. Third stage (Late expanding)-
Death rate declines still further and birth rate tends to fall, but population tends to grow as birth rate supersedes the death rates, but rates of population growth decelerates.
4. Fourth stage (Low stationary)-
This stage is characterized by low birth and low death rate with the result that the population becomes stationary. Most industrialized countries have gone through a demographic transition from a high birth and high death rates to low birth and low death rates.
5. Fifth stage (Declining):
Population begins to decline because birth rate is lower than death rate.
Important terminology and definition:-
1. Fertility/natality
Fertility is defined as the actual capacity to production/bearing of offspring/children natural conditions.
It is measured via fertility rate, which is calculated by the number of offspring produced by a childbearing couple in the total population.
Fertility in humans is measured within the child-bearing age of a woman, which is 15-49 years.
It depends on nutrition, endocrinology, emotions, consanguinity, instinct, sexual behavior, timing, economics, culture, etc. These factors are called the proximate determinants of fertility.
Indicator of fertility
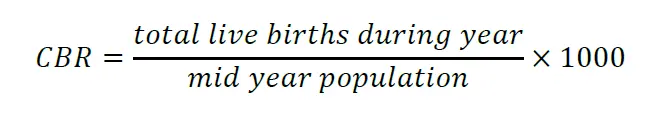
1) Crude birth rate (CBR)
CBR is defined as the number of live birth in a given year per 1000 mid year population.
2) Child women ratio (CWR)

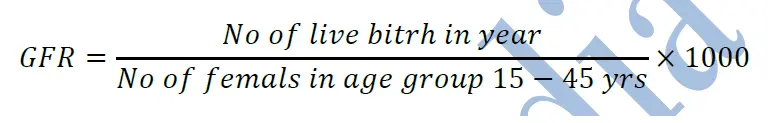
3) General fertility rate (GFR):
GFR is the number of live birth per 1000 women in the reproductive age group (15-45) in a given year.
4) General marital fertility rate (GMFR)
It is the number of live birth per 1000 married women in a given year in the reproductive age group (15-45 yrs).
5) ASFR (average specific fertility rate)
ASFR is the number of live births in a year to 1000 women in any specified age group (like 16-20 yrs, 21-25 yrs etc)
6) Total fertility rate (TFR)
It is Sum of ASFR of all age groups. (like ASFR 16-20 yrs + 21-25 yrs + 26-30 yrs….so on upto 41-45 yrs).
7) Gross reproductive rate (GRR):
It is the average number of girls that would be born to a woman during her reproductive period (15-45 yrs)
8) Net reproductive rate (NRR)
It is the number daughters (new born girl) that a female produces during her lifetime.
2. Fecundity
- Fecundity is the physical capacity/physiological ability to produce offspring/children (potential for reproduction) over a lifetime period.
- Fecundity can be quantified by calculating the approximate number of gametes, or reproductive cells.
- Example:
- A couple in which the male partner has a low to zero sperm count (due to factors such as genetic deletion) would be termed as having little to no fecundity (means no any potential for reproduction or no capability to produce offspring/children) .
- If the female had ovarian failure and difficulty in ovulation, she would also be described as having low fecundity.
- The world’s current fecundity rate is 20 children per woman, which is significantly lower than what it was a century ago. This is likely due to the vast changes in lifestyle factors between now and then.
Factors Affecting Fecundity
1. Age:
As age increases, reproductive potential decreases (both males and females).
2. Reproductive Tract Infections:
Some sexually transmitted infections such as chlamydia and gonorrhea can permanently decrease reproductive potential.
3. Lifestyle Factors:
Exposure to higher temperatures can lead to reduced fecundity. In addition, lifestyle behaviors such as smoking and diet have been correlated with limited reproductive potential. Obese men and women are more likely to be less fecund.
4. Hormones:
Hormone imbalances can lead to fecundity impairment in both men and women. Reduced release of FSH and/or LH is referred to as hypogonadism and can impact fecundity.
Difference between Fertility & fecundity
- Fertility refers to the natural/actual capability to produce offspring while fecundity refers to the potential/capability for reproduction of an organism or a population over lifetime.
- The fertility is measured in the form of fertility rate, which is the number of offspring produced by a mating pair or a population while the fecundity is measured by the number of gametes, seed set or asexual propagules and the survival of the young.
- Fertility depends on nutrition, endocrinology, emotions, consanguinity, instinct, sexual behavior, timing, economics, culture, etc. while fecundity depends on genetic and the environmental factors.
- Infertility refers to the lack of fertility while sterility refers to the lack of fecundity.
- Fecundity starts at first menstruation or menarche (or puberty) while fertility starts at sexual intercourse.
- Fecundity can not modified while fertility can be modified to control/expand population.
Note:
Semelparity: an organism or individual is described as semelparous when it reproduces only once in its life span. Such organisms reproduce and then eventually die, once they reproduce. Examples include certain bacteria, bamboo trees, and chinook salmon.
Iteroparity: an organism or individual that reproduces multiple times throughout their lifetime. Humans and primates fall under this category. These species can reproduce multiple times throughout their reproductive life span.
Demographic profile of India
- India is the second most populated country of the world after China.
- Around 2027, India is projected to overtake China as the world’s most populous country.
- Uttar Pradesh is the most populous State in the country
Age and sex composition
- According to the Census of India 2011, the population of India is 1210,569,573(121crore) comprising of 623,121,843 (62.3 crore) males and 587,447,730(58.7 crore) females.
- 68.86% Indian lives in rural areas and 31.14% lives in urban areas.
| Age groups | Total (%) | Rural (%) | Urban (%) |
| 0-14 years | 26.5 | 28.1 | 23.1 |
| 15-59 years | 65.4 | 63.8 | 68.6 |
| 60+ | 8.2 | 8.1 | 8.3 |
Sex ratio
- Sex ratio is defined as number of females per 1000 males. Sex ratio of India has improved by 10 from 933 in 2001 to 943 in 2011. In rural area sex ratio is 949 and in urban area sex ratio is 929.
- Sex ratio at birth can be affected by sex selectivity.
- Sex ratio at birth for the country has gone down by 2 points to 896 in 2015- 2017 from 898 in 2014-2016.
- Chhattisgarh has reported the highest sex ratio at birth (961) while Haryana, the lowest (833).
Health Indicators
1) Birth Rate
Birth rate is measured as total births per thousand populations. Birth rate of India has declined from 22.8 in 2008 to 20.2 in 2017.
2) Crude Death Rate
Death rate is defined as the number of deaths per thousand populations in a given region and time period.
3) Infant Mortality Rate
infant deaths (children less than one year) per thousand live births in a given time period and for a given region.
4)Maternal mortality ratio
The Maternal Mortality Ratio(MMR) is derived as the proportion of maternal deaths per 1,00,000 live births.
5) Neo-natal mortality rate
The first 28 days of life is called the neonatal period. It is the most vulnerable time for a child’s survival. In India the national average of neonatal deaths per 1,000 live births is 23.
6) Perinatal Mortality Rate
Perinatal mortality is defined as the number of stillbirths and deaths in the first week of life per 1,000 total births.
7) Under-five Mortality Rate (U5MR )
It is the Child mortality rate under 5 years of age.
Also Read…
Family Planning…
Join Our WhatsApp Group to receive the latest updates like Pharma Job notifications, study materials, admission alerts, Pharma News, etc
Join Our Telegram Group to receive the latest updates like Pharma Job notifications, study materials, admission alerts, Pharma News, etc
Join Our Telegram Group to Download Free Books & Notes, Previous papers for D.Pharm, B.Pharm, M.Pharm, Drug Inspector & GPAT……….
Comments are closed